[:en]This ETF gives you exposure to the Rand against the American dollar. A profit in this ETF is when the Rand weakens against the dollar.

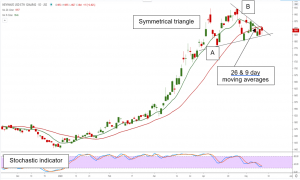
- The stochastic indicator confirms the oversold position of the Rand, which makes the probability for more weakness more likely.
- This ETF was caught within a symmetrical triangle and above line B (R18-48) the symmetrical triangle will confirm a bullish pennant, when line B changes into a support. Which implies that the weakness in the Rand can continue, as long as line B remains a support then.
- The 26 & 9 day moving average, have broken downwards which implied maybe a stronger Rand but since it appear as if the shorter 9 day moving average (green line) wants to break upwards again through the longer 26 day moving average (red line), and when it does the medium term sentiment will imply a weaker Rand again.
- Below line A (R18-26), we can expect a stronger Rand.
- For traders – Buy or consider a long above R18-55 but use R18-10 as stop loss to protect capital. The possible targets towards the top are: R18-66, R18-70, R18-95, R19-05 and R19-23.
- For medium to long term investors – The 40 week moving average (R15-68) is still a support which implies the long term sentiment towards this ETF is still a weaker Rand.
Frans & Christelle[:AF]Hierdie ETF gee jou blootstelling aan die Rand teenoor die Amerikaanse dollar in jou aandele rekening. Jy sal hier in wins wees wanneer die Rand teenoor die dollar verswak.

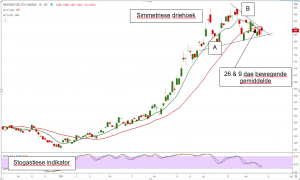
- Die stogastiese aanwyser bevestig die oorkoopte posisie van die Rand, wat die moontlikheid vir ‘n swakker Rand meer waarskynlik maak.
- Hierdie ETF is vasgevang in 'n simmetriese driehoek en bo lyn B (R18-48) sal die simmetriese driehoek 'n bul wiggie bevestig. Dit impliseer dat die swakheid in die Rand kan voortduur solank lyn B 'n steun bly.
- Die 26 & 9 dae bewegende gemiddeldes het afwaarts gebreek wat moontlik 'n sterker Rand sou kon beteken, maar aangesien dit lyk asof die korter, 9 dae bewegende gemiddelde (groen lyn) weer opwaarts wil breek deur die langer 26 dae bewegende gemiddelde (rooi lyn), sou die gemiddeldes weer na bo sou breek sal dit ‘n swakker sentiment vir die mediumtermyn belegger impliseer.
- Onder lyn A (R18-26) kan ons 'n sterker Rand verwag.
- Vir spekulante – Koop of oorweeg ‘n lank bo R18-55 maar gebruik R18-10 as keerverlies om kapitaal te beskerm. Die moontlike teikens na bo is: R18-66, R18-70, R18-95, R19-05 en R19-23.
- Vir medium tot lang termyn beleggers – Die 40 week bewegende gemiddelde (R15-68) is steeds ‘n steun wat beteken die lang termyn sentiment teenoor Rand is steeds ‘n swakker Rand.
Frans & Christelle[:]
